which graph
Which Graph? Name:
WALT- Analyse data in graphs to answer questions
Using the graphs above to help you answer these statements below.
Statement
True or False or Can’t Tell
Clearly shown on Bar Graph, Pie Graph, Both or Neither
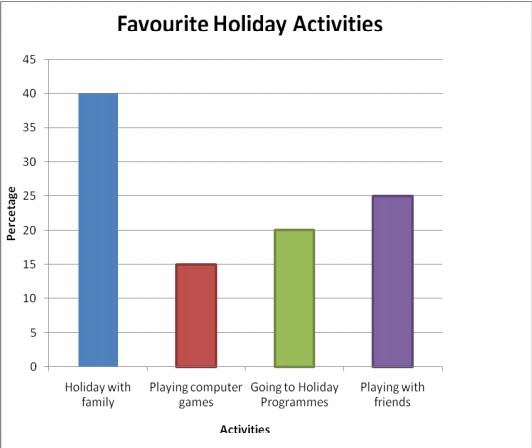
40% said their favourite activity is going on holiday with their family.
true
bar graph
Going to holiday programmes was a more popular choice than playing with friends.
false
pie graph
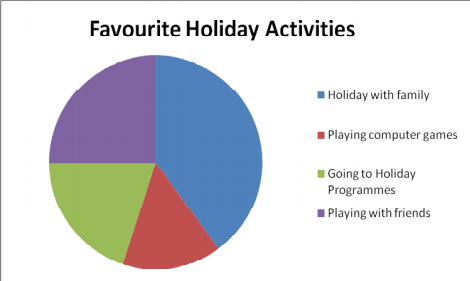
A quarter said their favourite activity is playing with friends.
true
pie graph
People like to take their friends on family holidays.
false
neither
10% more said their favourite activity is playing with friends than said playing with computers.
false
pie graph
Together being on holiday with family and playing with friends makes by more than half the votes.
true
pie graph
The most popular activity was going on holiday with family.
true
bar graph
A third said their favourite activity is going to holiday programmes.
true
pie graph
Twice as many people picked going on holiday with their family than picked going to holiday programmes.
true
pie graph
No comments:
Post a Comment